Option Chain Analysis - Quantitative Analysis of Stock Market
In stock market, we do three types of analysis:
- Fundamental Analysis, where we analyze the companies.
- Technical Analysis, where we analyze the charts and price action.
- Quantitative Analysis, where we analyze the data. Option Chain Analysis is a part of Quantitative Analysis.
When we opt for option trading in our Demat account, we get to see a long list of options that we can buy. This list is called Option Chain, or Option Matrix. In it we get to see a table of all the available options on a particular security.
In this article, we aim to understand this chain more deeply, and also some tricks to gain information from it that can help us gain profit in options trading.
Some experts give more importance to option chain analysis than even price action / technical analysis. So, put on your thinking cap.
 Note
NoteThis article expects that the readers know the basics of options trading. If you do not, you may read the following articles of ours:
Let’s begin.
 Table of Contents
- What do we get to see in Option Chain?
- Significance of Option Chain Analysis
- Some Tips based on Option Chain Analysis
What do we get to see in Option Chain?
Well, when you open an option chain in your Demat account or on some index website (say option chain on NSE website), you get to see a list of many options, having different strike prices. Call and Put options are given in separate sections.
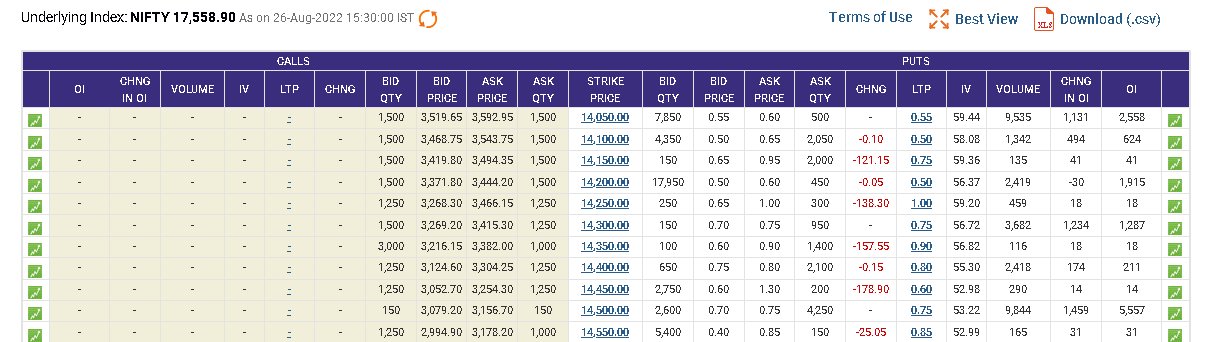
- On the Call side, the options having strike price below the spot price are on the top and shaded. That is, ITM options are shown above the OTM options (which have a white background).
- On the Put side, the options having strike price below the spot price are on the top and have a white background. That is, OTM options are shown above the ITM options (which have a shaded background).
Moreover, you will get to see the following data in an option chain:
- Strike Price: It displays the strike price of the option contracts.
- Bid Quantity and Bid Price: Tells us about the positions of the option buyers - the quantity and price at which the buyer is ready to buy.
- Ask Price and Ask Quantity: Tells us about the positions of the option sellers - the quantity and price at which the seller is ready to sell.
- LTP: Last traded price tells us the current premium of the option, i.e. the price at which that particular option is being traded.
- CHNG: It showcases the change in LTP on that day. A positive quantity implies that the LTP has increased on the present day, and a negative quantity implies that the LTP has decreased on the present day.
- IV (Implied Volatility): It shows the volatility in the market.
- Volume: It showcases the total number of a particular contract that have been traded over the course of the day. At the bottom of the table, you also get to see the sum total of all volume on the call, as well on the put side.
- OI (Open Interest): It shows the lots of outstanding open interests in a particular week (includes option lots bought/sold that day, carry forwards, hedging positions, etc.). At the bottom of the table, you also get to see the sum total of all outstanding open interests on the call, as well on the put side.
- Change in OI (Open Interest): In intra-day trading, change in open interest is a more significant data. That’s because it only shows the option lots sold/bought by traders on that particular day. So, it shows the trend of that day, and so is more relevant for intra-day traders. They rely on the PCR ratio derived from this data. (NSE website does not display the sum total of change in OI, which is used to derive the PCR ratio. But there are many software available in the market that do so.)
NoteOI (Open Interest) and Change in OI are related to both option buyers and sellers. They show the options that have been traded, i.e. the options that have been bought and sold.
NoteMoney invested in Indian options market is around 10-15 times more than that in Indian futures market. So, open interest data in option chain is more relevant that that of futures. This is the money that will drive the market up or down.
NoteYou may select the required underlying asset, expiry date, or strike price and the corresponding options will be displayed to you.
Open Interest Vs. VolumeNew traders often get confused between open interests and volume. Though both of them indicate the liquidity and activity of options (and futures too), they differ in a very fundamental way. Let’s understand their differences.
Volume tells us the number of contracts traded in a given period (generally one day), i.e. the number of trades completed each day. It is a running total, which is updated throughout the trading day.
While, Open Interest tells us the number of contracts that are active (not yet settled), i.e. those held by traders and investors in active positions. It’s updated once a day.
Both of these data help traders to gauge the liquidity of the market and future price action. For example, high volume and high open interest means that the market is liquid, i.e. there are many buyers and sellers for a particular option.
If the volume is high but open interest is low for an option, then there may also be low liquidity. Option sellers may find it hard to find buyers. On the other hand, high open interest indicates that a large number of traders have taken active positions in that option.
Significance of Option Chain Analysis
- As per some experts, Option Chain Analysis is more powerful and accurate than several indicators.
- Option Chain Analysis has gained prominence since the commencement of weekly expiry in options trading.
Some Tips based on Option Chain Analysis
Make use of PCR ratio
The most important data you can derive from option chain table is the PCR data, which is the ratio of the change in open interests on the put and call side.
If PCR is more than 1.25, then it’s a bullish signal and so you should buy call options (or sell put options). If PCR is less than 0.75, then it’s a bearish signal and so you should buy put options (or sell call options). As per some experts, this strategy is 70% accurate.
If PCR is around 1, then it means that the market will move sideways. If PCR is more than 1.5, or less than 0.5 then it means that the market will move very much, very fast.
You may find out the individual PCR for each strike, as well as the combined/overall PCR of all the strikes. Combined PCR of multiple strikes is obviously more accurate than that of a single strike – it will give a better prediction of the future price action.
Professional traders that trade in weekly options generally take into account 10-15 nearby strikes (to ATM) – the strikes that have premium and are actively being traded. For example, you may consider 8 strikes above and 8 strikes below the ATM to find out PCR ratio. Open strikes that are too far away (i.e. OTM strikes) are not that relevant.
If the option expiry is far away, we take into account more strikes. But as soon as the option expiry comes nearby, we may use less and less strikes to find out the PCR. As a thumb rule, you should only consider the strikes that have some decent premium – at least above Rs. 20.
In fact, as per some experts, on the expiry day even considering three strikes (ATM strike, and one strike above and below it) is good enough. If you are considering more strikes than necessary to calculate the PCR, you may end up having less relevant/useful PCR.
NoteThis strategy works pretty well with index options, e.g. Nifty options, Bank Nifty options. It also works well in case of stock options that have decent liquidity. This strategy may not be that accurate if liquidity is not high enough.
Index options such as that of Nifty and Bank Nifty have a weekly expiry. Whereas, stock options have a monthly expiry.
Have a look at the IV value
IV means Implied Volatility. If IV increases, the premiums of options get costlier. If volatility gets over 20, the premiums will start getting overpriced. More the premium, bigger the stop losses – not good for option buyers. So, high IV is good for option sellers, but bad for option buyers.
In general, if IV is below 20, then it’s considered normal – the option premium can be considered fairly priced at least from the volatility point of view.
NoteAs per some experts:
In Bull market, IV > 21 is considered high, and IV < 15 is considered low.
In Bear market, IV > 38 is considered high, and IV < 21 is considered low.
In Neutral/Sideways market, IV > 20 is considered high, and IV < 12 is considered low.
The most important IV is that of the ATM option (the option that is trading near the spot price, i.e. which has its strike price closest to the spot price). It will give you a good idea of the volatility in the market.
NoteIn the option chain, you will get to see two ATM options – one on the call side and the other on the put side.
As per some experts, you should buy the ATM option that has higher IV (in intra-day trading). Low IV means that there are probably a lot of option sellers/writers, i.e. many option sellers want you to buy that kind of option. You should do opposite to what sellers want.
NoteIV is part of the volatility Greek vega. If you want to learn more about it, you may read this article of ours.
Find the Resistance and Support levels
Open Interest may help you to guess the resistance level (the level above which the market is unable to go) and the support level (the level below which the market is unable to go) of the market.
Have a look at the following data table depicting some columns of Bank Nifty option chain:

The strikes having the highest open interest have been highlighted.
On the Call side, the 37000 CE strike has the highest open interest. It means that options sellers have invested a lot of money on this strike. If the price moves above 37000, they will suffer huge losses. Now, remember that sellers are big bulls with deep pockets. They will try their best to keep the markets below 37000 level. So, 37000 level will act like a resistance – market price will find it hard to move above it.
Similarly, on the Put side, the 36900 PE strike has the highest open interest. It means that options sellers have invested a lot of money on this strike. If the price moves below 36900, they will suffer huge losses. They will try their best to keep the markets above 36900 level. So, 36900 level will act like a support – market price will find it hard to move below it.
So, looking at the highest open interest data on both call and put side, we can tell the price range of the market on any given day, and trade accordingly. As per the above data, the market will most probably move in the range of 36900 to 37000.
You may find more resistance and support levels using the same method.
There are many option strategies that need you to have a view on the upper and lower range of the market. This data will help you make better estimates, and so will improve your chances of making profits.
NoteResistance and Support levels depend on the fund deployment. For this we see Open Interests, and not Change in Open Interests. We consider Change in Open Interests for finding PCR ratio (esp. for intra-day trading).