Various types of Candlestick Patterns – Technical Analysis in Stock Market Trading
If you have just started reading about Share Market and you are doing some research on the internet regarding the same, then you must have heard about Price Action, Technical Analysis and Candlestick Patterns.
Well, traders involved in Intra-day trading, options and futures take decisions to invest or book profit based on their analysis of the current chart of a share index (say Nifty 50 or Nifty Bank), or of a particular share or commodity. This analysis is called Technical Analysis and the ever-changing value of a particular index/share/commodity chart is called Price Action.
Such charts are shown with the help of two major types of candles – Green candles to show an upward trend and Red to show a downward trend. But only if the things were so simple.
These candles may be long, short, and vary on the basis of where they are formed. All this can give a lot of clues to a trained/experienced person regarding the future movement of the market. Any stock market trader who can predict the near-future trend of the market (even for the next 1-2 minutes) can become a big bull of the market.
In this article, we are going to introduce you to a very important aspect of Data Interpretation of market charts - Candlestick Patterns.
However, keep in mind that consistency and accuracy only improve with time and practice. But reading the theory can be considered the first step in the right direction.
 Trader Vs. Investor
Before you enter the stock market, you must ask yourself what your end goal is. You want to be a Trader, or an Investor, or maybe both.
For Investment (Delivery), look at fundamentals, i.e. we need to have a long term planning. For that, we need to look at the balance sheet of the company, company fundamentals (profit, P/E ratio, P/B ratio, asset/liability, etc.), management of the company, current news, government policy, etc.
For Trading (Intra-day, Options, Futures), look at technical data, i.e. current trend/chart/data. It’s for such a short term that long term things (like company management, profitability, etc.) doesn’t matter much.
Candlestick Patterns is a concept related to technical analysis of the chart data, and so is of more use to the Traders (not that important for Investors). Our website is more about creating money, getting jobs and setting up businesses and passive incomes (rather than investment). So, we will be more inclined towards Trading, which is a good (though a bit risky) way to make money online.
 Table of Contents
- What are Candlesticks in Stock Market Charts?
- Types of Candlestick Patterns
What are Candlesticks in Stock Market Charts?
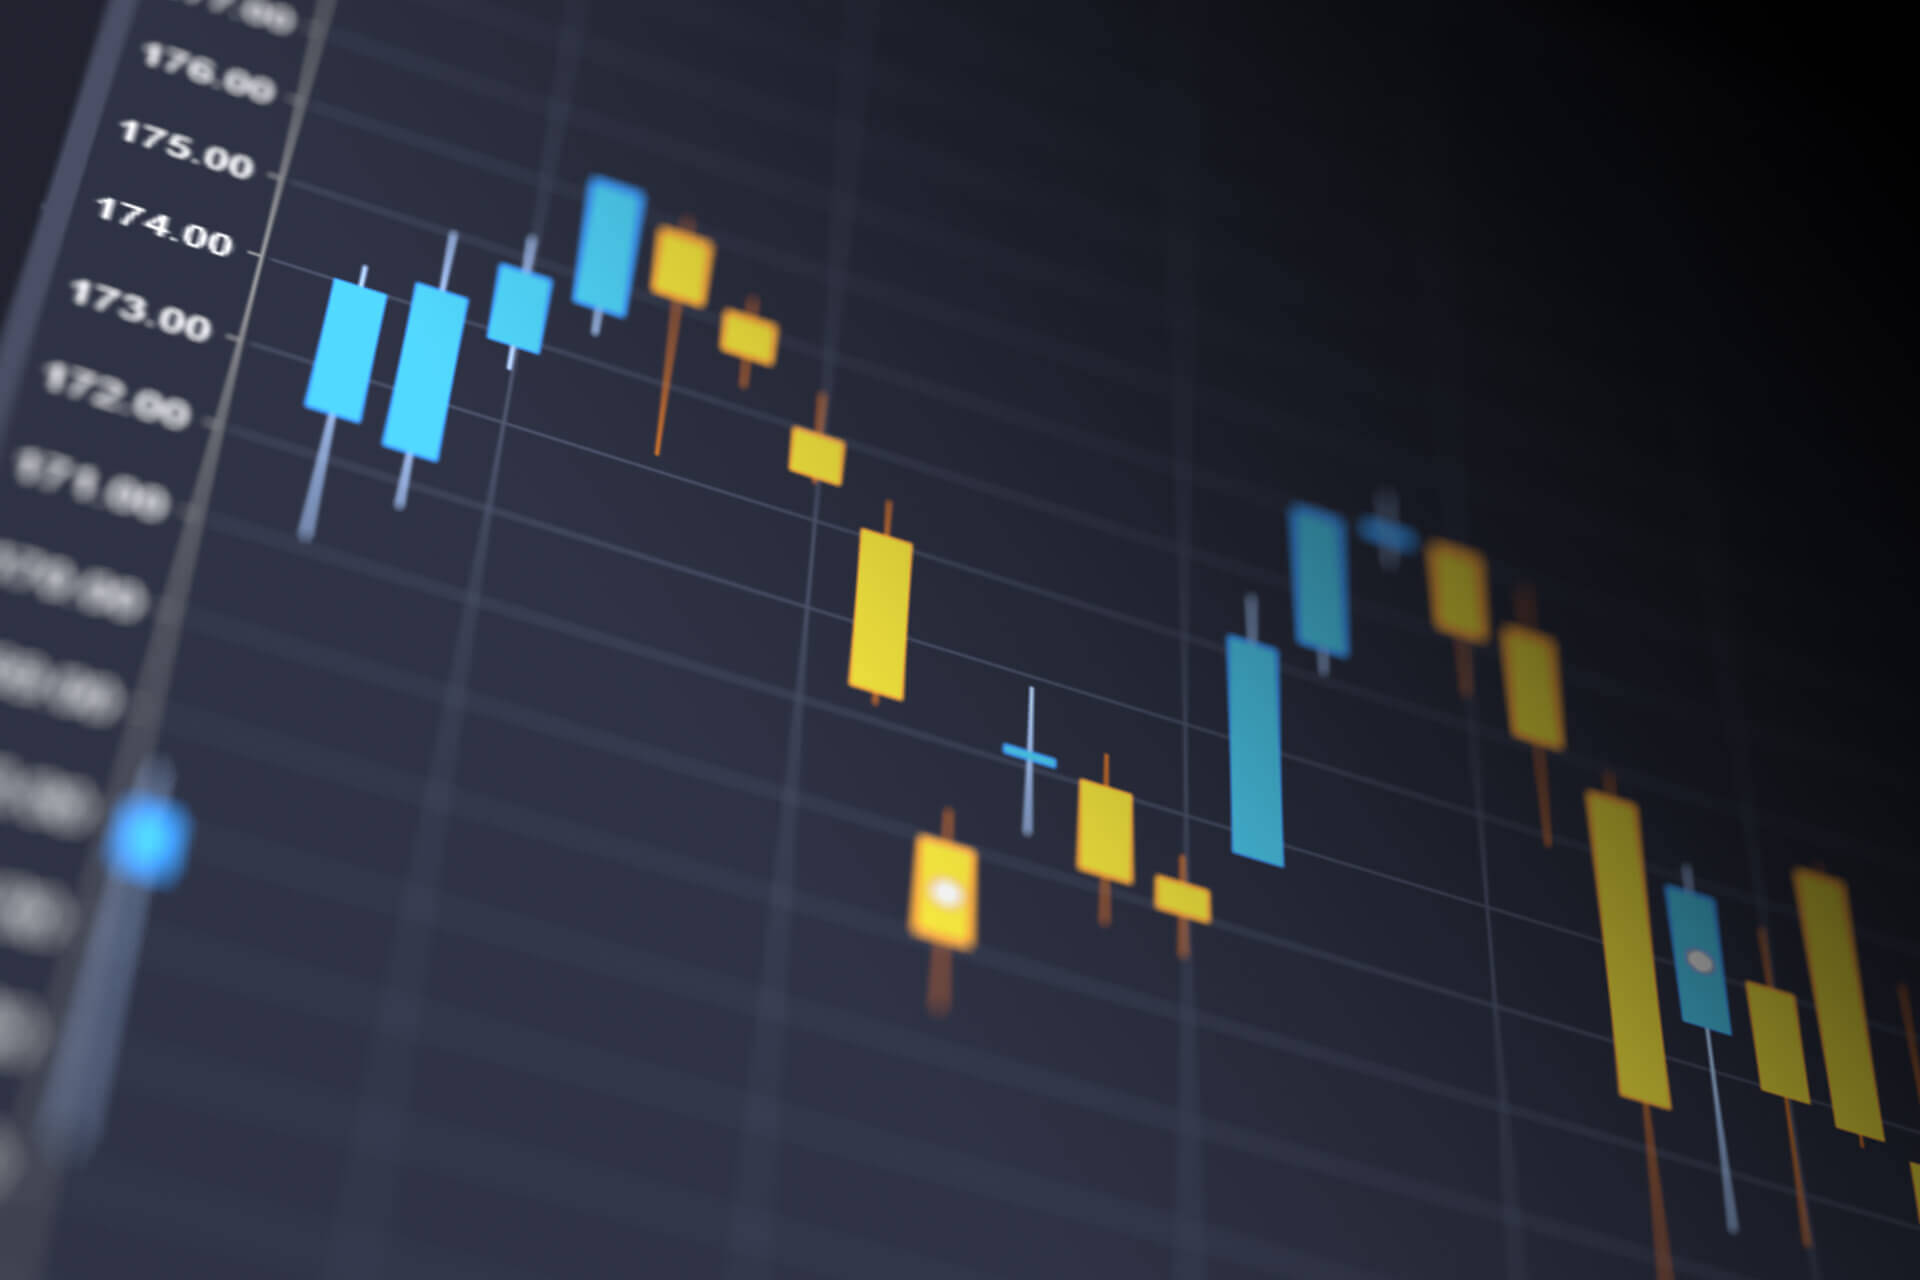
Candlesticks are used in stock market charts to make the fall and rise of market more vivid to the observers. For this purpose, two types of candlesticks are used:
- Green or White candlesticks showcase a rise in the market (i.e. a bullish market trend). In other words, it shows an uptrend in the market.
- Red or Black candlesticks showcase a fall in the market (i.e. a bearish market trend). In other words, it shows a downtrend in the market.

Obviously, a green candlestick will open at a lower price and close at a higher price. While, a red candlestick will open at a higher price and close at a lower price. The range between the opening and closing prices is shown by solid red/green coloured candle body.
While, the highest price point touched by a candlestick is called High, and represented by an Upper Shadow Wick. Similarly, the lowest price point touched by a candlestick is called Low, and represented by a Lower Shadow Wick.
For example, if a stock X opened at a price of Rs. 100, went down till Rs. 90, then went up till Rs. 108, and finally closed at a price of Rs. 101, then:
- Open: Rs. 100
- Close: Rs. 101
- High: Rs. 108
- Low: Rs. 90
- Colour of the candle will be green or white, as Closing Price – Opening Price = 101 – 100 = Rs. 1, which is positive.
Sideways TrendSometimes the market neither goes up, nor down. Rather it moves horizontally. Such a trend is called sideways trend.
Option buyers often do not invest when they see this trend, as they cannot book profit during this time, and the more they wait, the more premium decay they have to face. However, option sellers find it beneficial as they earn premium during this time. We will learn about the concepts of Options, Premium decay, etc. in a separate article.
Now, these candlesticks can represent any time frame – a year, month, day, hour, 10 minutes, 5 minutes, 3 minutes, or just a minute. You may choose the appropriate time-frame in your online trading platform (Zerodha, Groww, etc.).
Types of Candlestick Patterns
Now, let’s have a look at the various types of Candlestick Patterns that we encounter in a stock market chart and how to interpret them.
NoteKeep in mind that all this theory regarding Candlestick Patterns is only based on general trends seen in the market. But if you trade long enough, you will definitely see some exceptional situations wherein all these theories will break.
The candlestick patterns may be formed using:
- A single candlestick
- Two candlesticks
- Three or more candlesticks
Let’s have a look at them one by one.
Single-Candlestick Patterns
Hammer and Hanging Man
Such candlesticks have a small body, a small upper shadow wick, but a very long lower shadow wick. The lower shadow wick is almost two-three times the body of the candlestick in length.

Both of them look the same, the only difference being:
- Hammer – it’s formed at the lower part of the chart, i.e. when there in an ongoing bearish market.
- Hanging Man – it’s formed at the upper part of the chart, i.e. when there in an ongoing bullish market.
Keep in mind that both of them can be red or green.
Such candlestick patterns indicate that the market trend is about to reverse.
- When we see a Hammer pattern, it means that the market is about to get bullish (i.e. an upward trend is about to come). However, to be doubly sure wait for the next candle too. If the next candle closes above the high of the hammer candle, then it’s a strong sign that there’s going to be an uptrend. You can start trading here. Place your Stop Loss (SL) just below the lower wick (low) of the hammer.
- When we see a Hanging Man pattern, it means that the market is about to get bearish (i.e. a downward trend is about to come). However, to be doubly sure wait for the next candle too. If the next candle closes below the low of the hanging man candle, then it’s a strong sign that there’s going to be a downtrend. You can start trading here. Place your Stop Loss (SL) just above the upper wick (high) of the hanging man.
 Warning
Hammer and Hanging Man patterns have no significance when they are formed during sideways movement of the market.
Inverted Hammer and Shooting Star
Such candlesticks have a small body, a small lower shadow wick, but a very long upper shadow wick. The upper shadow wick is almost two-three times the body of the candlestick in length.

Both of them look the same, the only difference being:
- Inverted Hammer – it’s formed at the lower part of the chart, i.e. when there in an ongoing bearish market.
- Shooting Star – it’s formed at the upper part of the chart, i.e. when there in an ongoing bullish market.
Keep in mind that both of them can be red or green.
Such candlestick patterns indicate that the market trend is about to reverse.
- When we see an Inverted Hammer pattern, it means that the market is about to get bullish (i.e. an upward trend is about to come). However, to be doubly sure wait for the next candle too. If the next candle closes above the high of the inverted hammer candle, then it’s a strong sign that there’s going to be an uptrend. You can start trading here. Place your Stop Loss (SL) just below the lower wick (low) of the inverted hammer.
- When we see a Shooting Star pattern, it means that the market is about to get bearish (i.e. a downward trend is about to come). However, to be doubly sure wait for the next candle too. If the next candle closes below the low of the shooting star candle, then it’s a strong sign that there’s going to be a downtrend. You can start trading here. Place your Stop Loss (SL) just above the upper wick (high) of the shooting star.
WarningInverted Hammer and Shooting Star patterns have no significance when they are formed during sideways movement of the market.
Dragonfly Doji and Gravestone Doji
If a candlestick closes at the same point where it started, then such a candlestick is called Doji (or Standard Doji). It’s generally black in colour and it signifies that the sellers and buyers in the market are almost putting in the same effort, i.e. as many shares are being bought as they are being sold.

Now, let’s understand Dragonfly Doji and Gravestone Doji.
Both Dragonfly Doji and Gravestone Doji candlesticks have a very small body (much smaller than other types of candlesticks, such as hammer, spinning top, etc.). Keep in mind that both of them can be red or green.
Dragonfly Doji has a very long lower shadow wick. A green Dragonfly Doji signifies that the price of the stock went very low from the point it opened (i.e. sellers sold a lot of shares), but it recovered and closed at a higher point (i.e. buyers won the final battle). Say, a stock opened at Rs. 100, wend down till Rs. 66, and then closed at Rs. 102.
Gravestone Doji has a very long upper shadow wick. A red Gravestone Doji signifies that the price of the stock went very high from the point it opened (i.e. buyers bought a lot of shares), but it collapsed and closed at a lower point (i.e. sellers won the final battle). Say, a stock opened at Rs. 100, wend up till Rs. 134, and then closed at Rs. 98.
Such candlestick patterns indicate that the market trend is about to reverse.
- When we see a Dragonfly Doji pattern being formed at the lower part of the chart, i.e. when there in an ongoing bearish market, it means that the market is about to get bullish (i.e. an upward trend is about to come). However, to be doubly sure wait for the next candle too. If the next candle closes above the high of the Dragonfly Doji candle, then it’s a strong sign that there’s going to be an uptrend. You can start trading here. Place your Stop Loss (SL) just below the lower wick (low) of the Dragonfly Doji.
- When we see a Gravestone Doji pattern being formed at the upper part of the chart, i.e. when there in an ongoing bullish market, it means that the market is about to get bearish (i.e. a downward trend is about to come). However, to be doubly sure wait for the next candle too. If the next candle closes below the low of the Gravestone Doji candle, then it’s a strong sign that there’s going to be a downtrend. You can start trading here. Place your Stop Loss (SL) just above the upper wick (high) of the Gravestone Doji.
Spinning Top
These candlesticks have a small body, and a pretty long upper and lower shadow wick. The shadow wicks are almost two-three (or more) times the body of the candlestick in length.
Keep in mind that it can be red or green.
Such candlestick patterns indicate that the market trend is about to reverse.
- When we see a Spinning Top pattern being formed at the lower part of the chart, i.e. when there in an ongoing bearish market, it means that the market is about to get bullish (i.e. an upward trend is about to come). We call it Bullish Spinning Top. However, to be doubly sure wait for the next candle too. If the next candle closes above the high of the Spinning Top candle, then it’s a strong sign that there’s going to be an uptrend. You can start trading here. Place your Stop Loss (SL) just below the lower wick (low) of the Spinning Top.
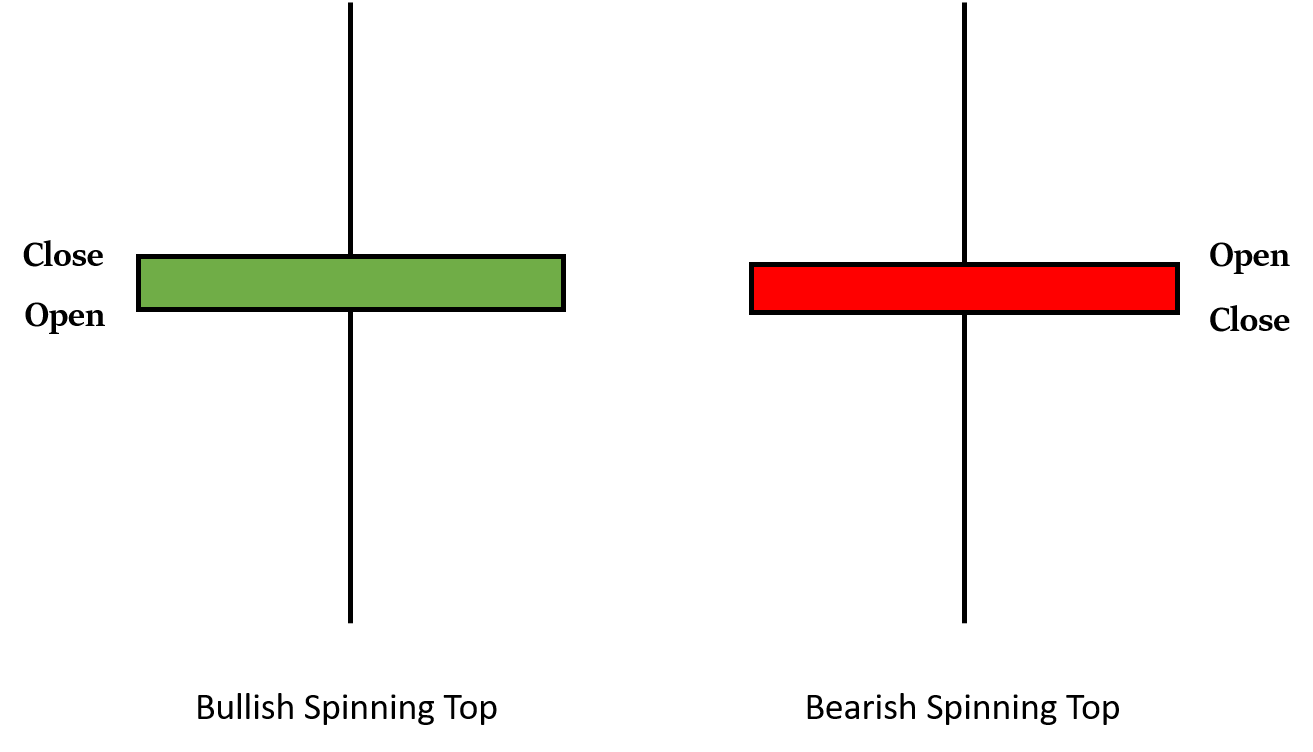
- When we see a Spinning Top pattern being formed at the upper part of the chart, i.e. when there in an ongoing bullish market, it means that the market is about to get bearish (i.e. a downward trend is about to come). We call it Bearish Spinning Top. However, to be doubly sure wait for the next candle too. If the next candle closes below the low of the Spinning Top candle, then it’s a strong sign that there’s going to be a downtrend. You can start trading here. Place your Stop Loss (SL) just above the upper wick (high) of the Spinning Top.
Marubozu
Marubozu means dominance. These candlesticks have a large body, and a pretty small (or non-existent) upper and lower shadow wicks. So, for a candle to be called Marubozu, it should satisfy two conditions:
- The body of the candle should be big. Even if a candle has very small wick, but its body is not large enough, then it cannot be called Marubozu.
- The wick of the candle must be comparatively very smaller than its body.
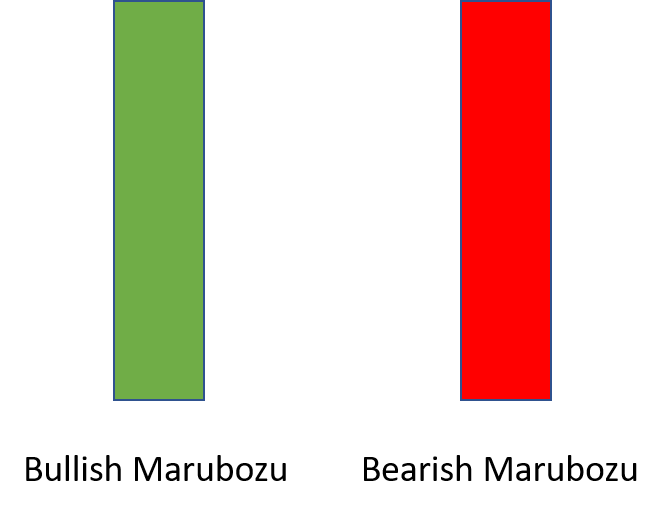
Keep in mind that it can be red or green.
Such candlestick patterns indicate that the market trend will change and gain momentum.
- When we see a Marubozu pattern being formed at the lower part of the chart, i.e. when there in an ongoing bearish market, it means that the market is about to get bullish (i.e. an upward trend is about to come). We call it Bullish Marubozu.
- When we see a Marubozu pattern being formed at the upper part of the chart, i.e. when there in an ongoing bullish market, it means that the market is about to get bearish (i.e. a downward trend is about to come). We call it Bearish Marubozu.
Two-Candlestick Patterns
Bullish and Bearish Kicker
- Bullish Kicker: When a green Marubozu is formed after a red Marubozu at the bottom of the chart (it is a signal that the market can get bullish). The green Marubozu will open at a higher price than the price point where the red Marubozu opened (i.e. there is a gap-up opening). If there is no wick in these candles, then it’s a strong Bullish Kicker. However, even if there is a small wick present, we will still consider it a decent Bullish Kicker signal. But you should wait for the third candle before you enter the market. If the third candle closes at a higher point than the high of the second candle, then you may enter trading at the high of the third candle. Our stop loss (SL) will be the low of the first candle. (If you do not get confirmation in the third candle, then wait for the fourth candle)
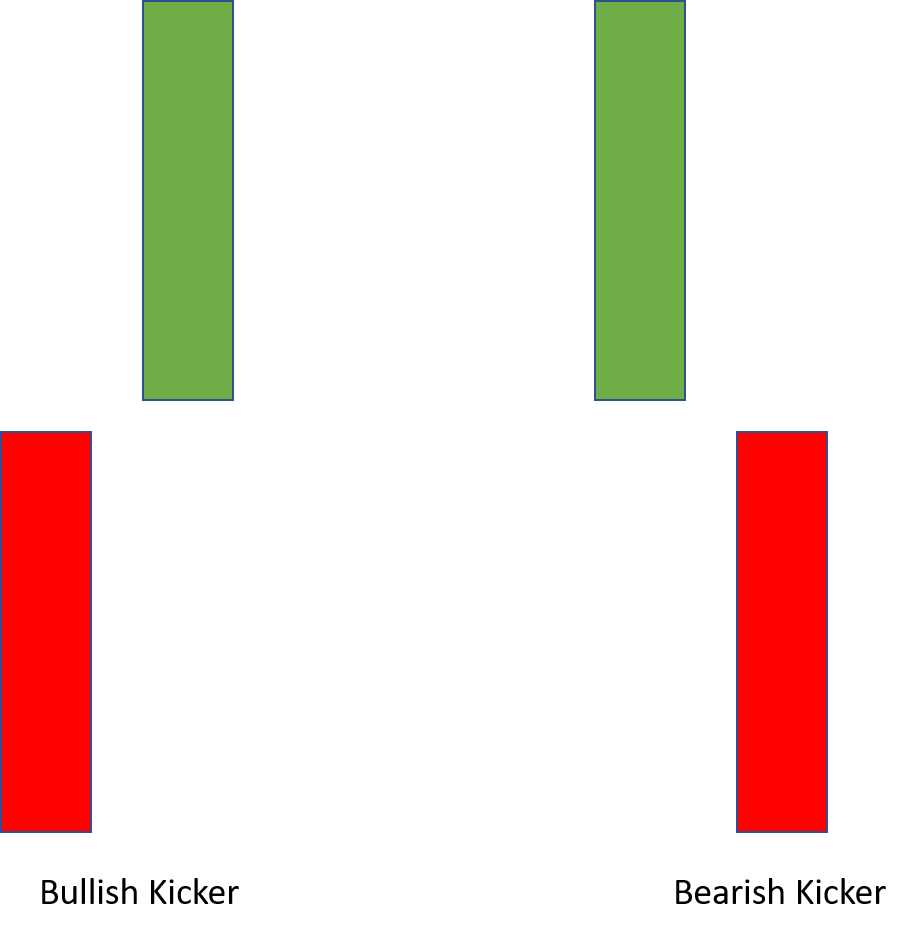
- Bearish Kicker: When a red Marubozu is formed after a green Marubozu at the top of the chart (it is a signal that the market can get bearish). The red Marubozu will open at a lower price than the price point where the green Marubozu opened (i.e. there is a gap-down opening). If there is no wick in these candles, then it’s a strong Bearish Kicker. However, even if there is a small wick present, we will still consider it a decent Bearish Kicker signal. But you should wait for the third candle before you enter the market. If the third candle closes at a lower point than the low of the second candle, then you may enter trading at the low of the third candle. Our stop loss (SL) will be the high of the first candle. (If you do not get confirmation in the third candle, then wait for the fourth candle)
NoteIn case of Bullish and Bearish Kicker, even if the Marubozu candlesticks are a bit small in size, we will still consider it a decent Bullish or Bearish Kicker signal.
Bullish and Bearish Engulfing
- Bullish Engulfing: When a red candle is engulfed by a green candle at the bottom of the chart. The body of the red candle must lie within the boundaries of the body of the green candle (it is a signal that the market can get bullish). Also, the trade volume in the second candle must be more than the first candle.
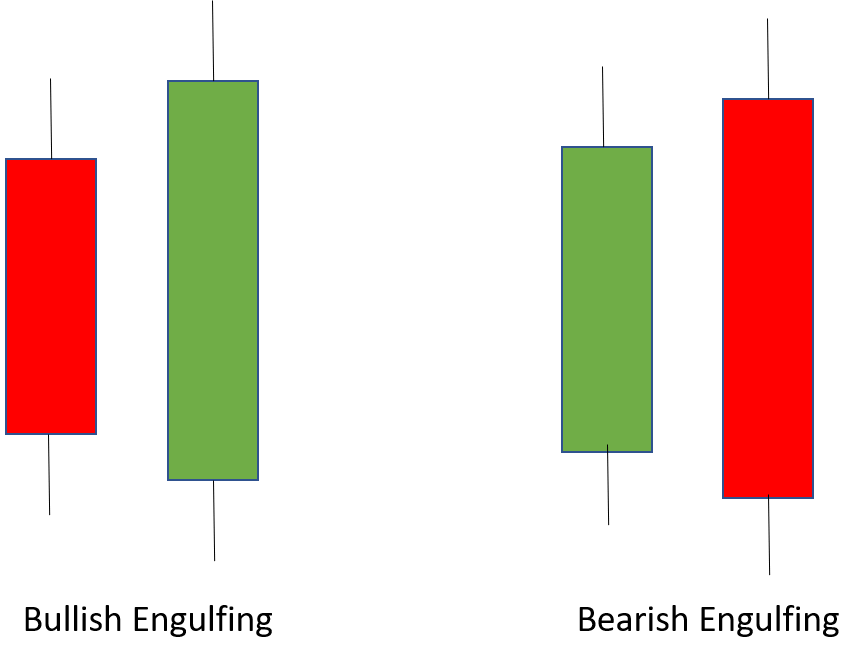
- Bearish Engulfing: When a green candle is engulfed by a red candle at the top of the chart. The body of the green candle must lie within the boundaries of the body of the red candle (it is a signal that the market can get bearish). Also, the trade volume in the second candle must be more than the first candle.
Bullish and Bearish Harami
The concept of these candles is opposite to those of Engulfing candles.
- Bullish Harami: When a bigger red candle (mother) is followed by a smaller green candle (child) at the bottom of the chart. The body of the child candle must lie within the boundaries of the body of the mother candle (it is a signal that the market can get bullish). Also, the second candle must open with a gap-up opening. But you should wait for the third candle before you enter the market. If the third candle closes at a higher point than the high of the second candle, then you may enter trading at the high of the third candle. Our stop loss (SL) will be the low of the first candle, i.e. mother candle. (If you do not get confirmation in the third candle, then wait for the fourth candle)
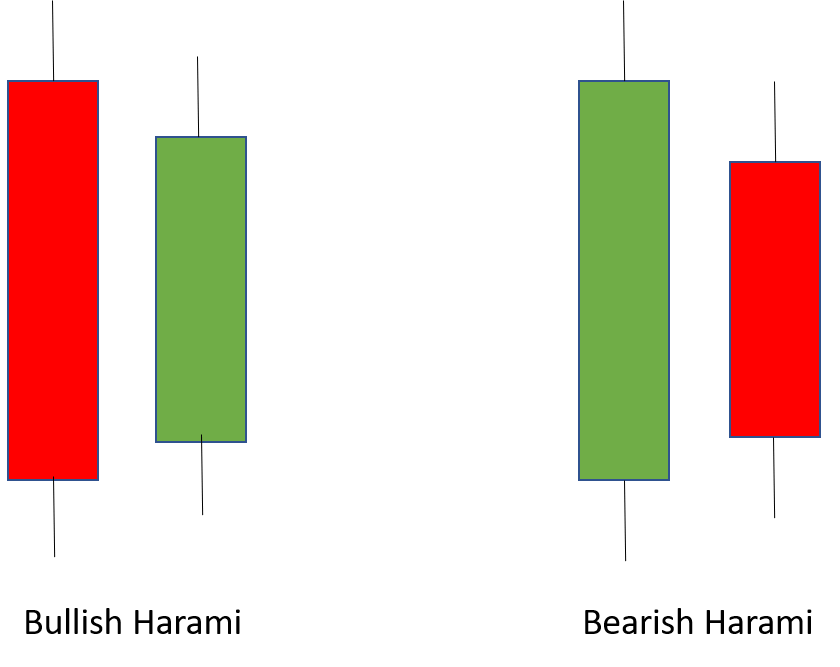
- Bearish Harami: When a bigger green candle (mother) is followed by a smaller red candle (child) at the top of the chart. The body of the child candle must lie within the boundaries of the body of the mother candle (it is a signal that the market can get bearish). Also, the second candle must open with a gap-down opening. But you should wait for the third candle before you enter the market. If the third candle closes at a lower point than the low of the second candle, then you may enter trading at the low of the third candle. Our stop loss (SL) will be the high of the first candle, i.e. mother candle. (If you do not get confirmation in the third candle, then wait for the fourth candle)
NoteHarami in Japanese means a pregnant lady.
Piercing Line and Dark Cloud Cover
- Piercing Line: When a red candle is followed by a green candle at the bottom of the chart, in such a manner that the green candle closes at a higher point than the point at which the red candle closed. Also, if you draw a line from the middle of the body of the red candle, the green candle must close at a point above that line. Also, the trade volume in the second candle must be more than the first candle. It is a signal that the market can get bullish.
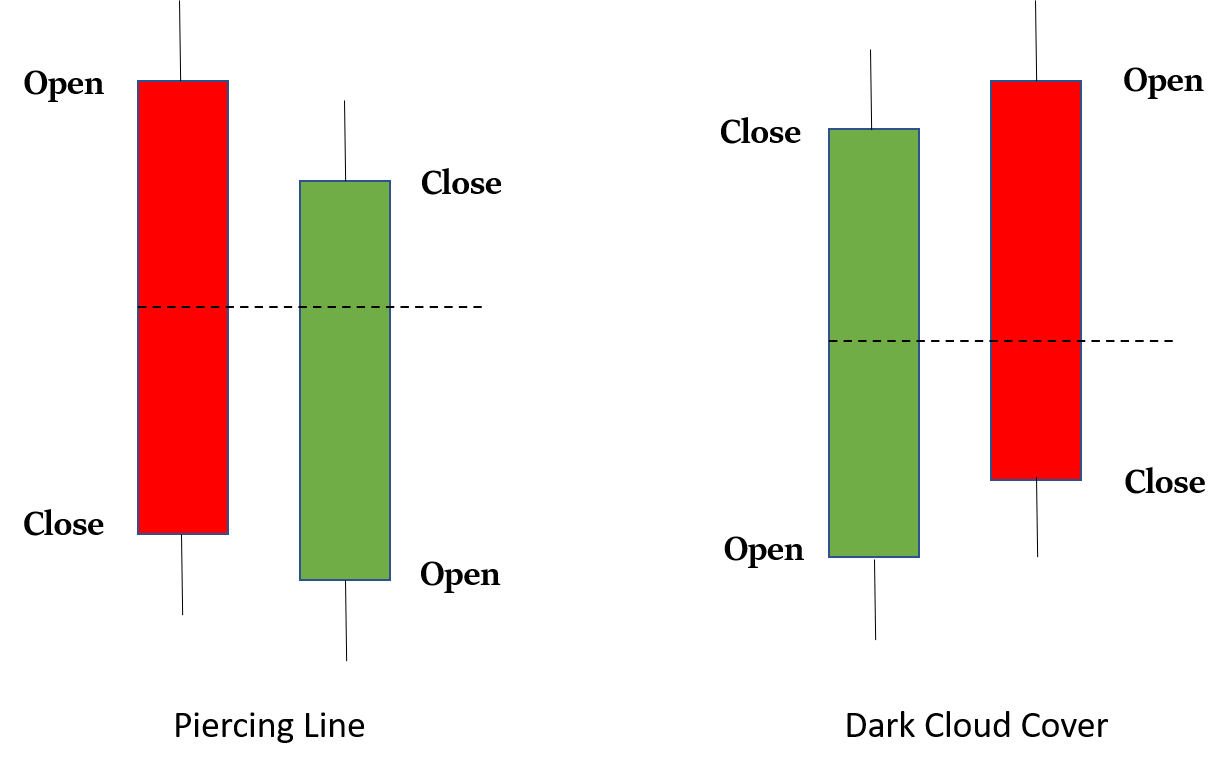
- Dark Cloud Cover: When a green candle is followed by a red candle at the top of the chart, in such a manner that the red candle closes at a lower point than the point at which the green candle closed. Also, if you draw a line from the middle of the body of the green candle, the red candle must close at a point below that line. Also, the trade volume in the second candle must be more than the first candle. It is a signal that the market can get bearish.
Tweezer Bottom and Tweezer Top
Tweezer can be formed in twelve ways. So, the way these pair of candles will look may vary, but the underlying concept is the same in all of them.
- Tweezer Bottom: If the low of two consecutive candles is the same. The colours of the candles do not matter. It is formed at the bottom of the chart and signals an upcoming bullish trend. It’s not necessary that the trade volume of the second candle should be more than the first candle, but if it is then even better.
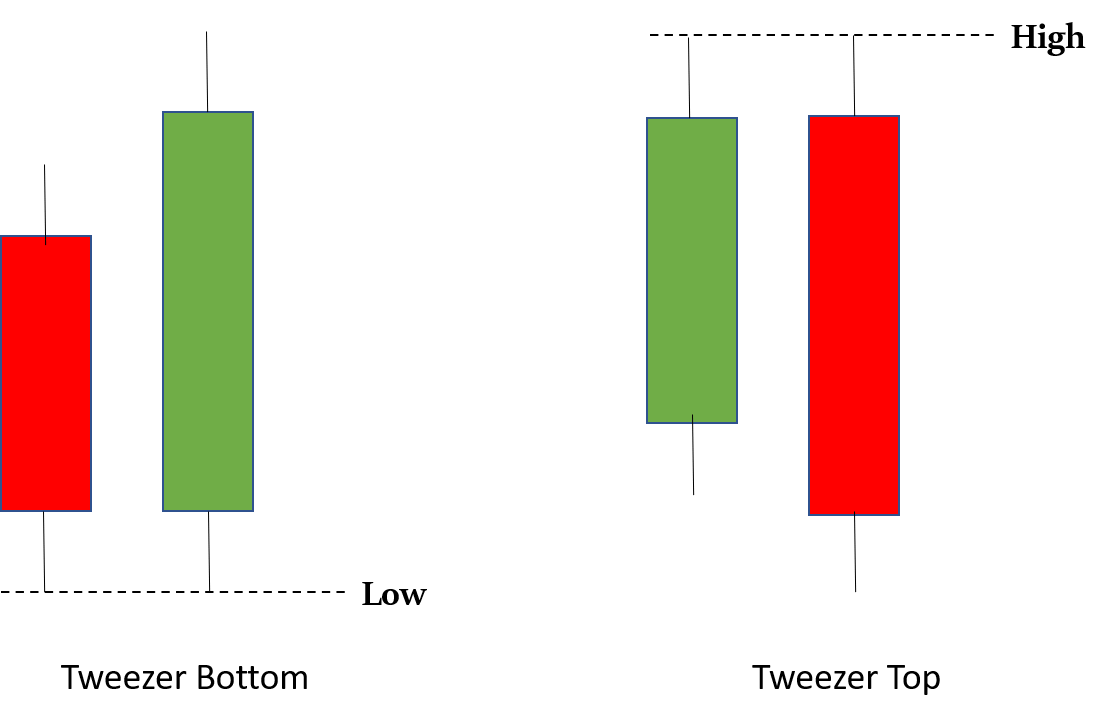
- Tweezer Top: If the high of two consecutive candles is the same. The colours of the candles do not matter. It is formed at the top of the chart and signals an upcoming bearish trend. It’s not necessary that the trade volume of the second candle should be more than the first candle, but if it is then even better.
Multiple-Candlestick Patterns
Morning Star and Evening Star
- Morning Star: It is a pattern consisting of three candles – the first candle will be red, then the second candle will form after a gap-down opening (this is the star candle, and its colour does not matter), thereafter the third candle will form with a gap-up opening and it will be green in colour. It is formed at the bottom of the chart and signals that the market may get bullish. For trade, wait for the formation of the next candle (i.e. the fourth candle). If it closes at a higher point than the closing point of the third candle, then you may enter the trade. You may place the stop loss at the low of the morning star candle (i.e. the second candle).
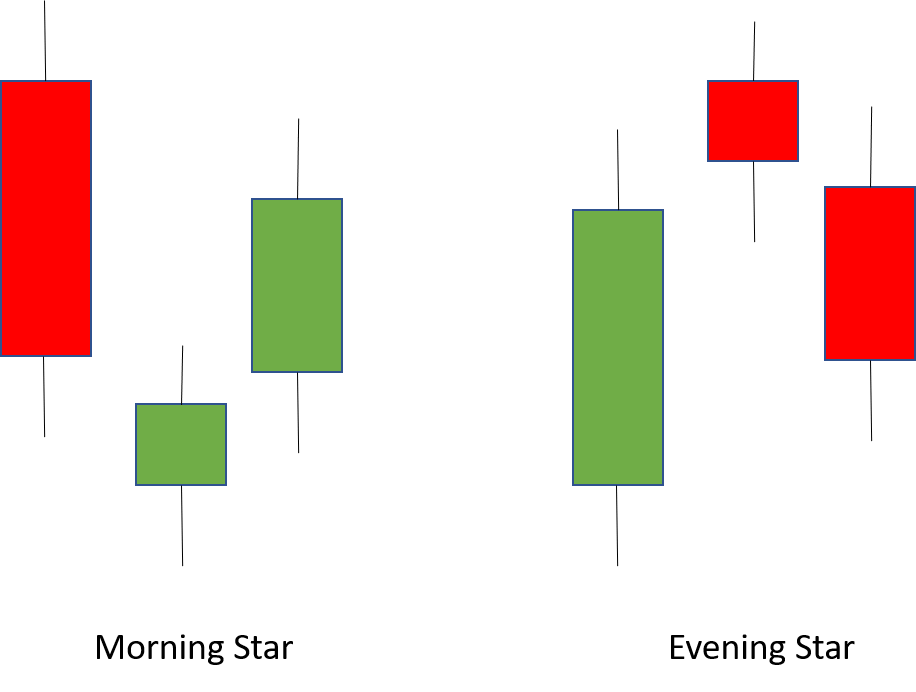
- Evening Star: It is a pattern consisting of three candles – the first candle will be green, then the second candle will form after a gap-up opening (this is the star candle, and its colour does not matter), thereafter the third candle will form with a gap-down opening and it will be red in colour. It is formed at the top of the chart and signals that the market may get bearish. For trade, wait for the formation of the next candle (i.e. the fourth candle). If it closes at a lower point than the closing point of the third candle, then you may enter the trade. You may place the stop loss at the high of the evening star candle (i.e. the second candle).
Bullish and Bearish Abandoned Baby- Bullish Abandoned Baby: It is pretty similar to Morning Star candlestick pattern. The only main differences being that the second candle opens with a bigger gap-down opening, and its body is much smaller (can even be a Doji).
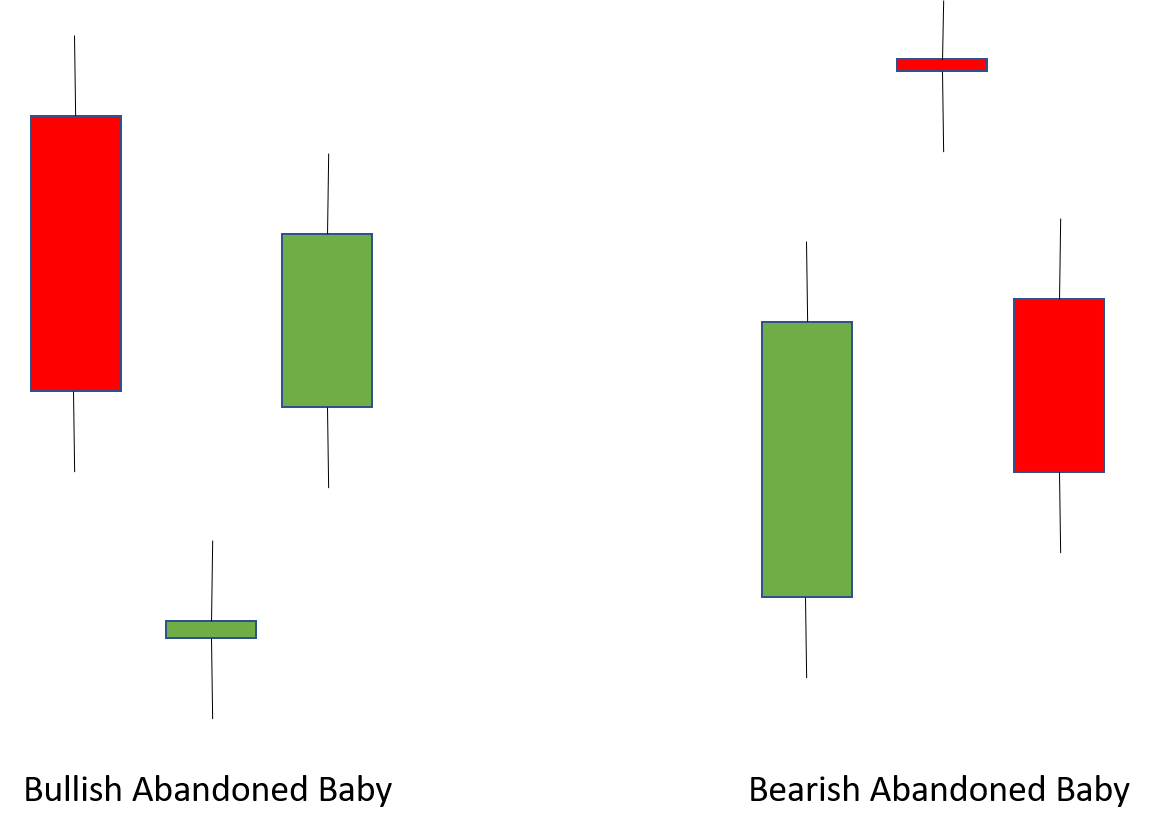
- Bearish Abandoned Baby: It is pretty similar to Evening Star candlestick pattern. The only main differences being that the second candle opens with a bigger gap-up opening, and its body is much smaller (can even be a Doji).
NoteWe know that in our demat account, we can see candlesticks of any duration – 1 minute, 3 minutes, 5 minutes, etc. If you assume that the morning star pattern given above is formed by 1-minute candles, then in 3-minute candlestick chart only one candle will be formed in place of these three one-minute candles, and that will look like a hammer candlestick (which also denotes that the market may get bullish).
Similarly, if you assume that the evening star pattern given above is formed by 1-minute candles, then in 3-minute candlestick chart only one candle will be formed in place of these three one-minute candles, and that will look like a shooting star candlestick (which also denotes that the market may get bearish).
So, the candlestick patterns you see will also vary depending on the chart you are watching.
Three White Soldiers and Three Black Crows
- Three White Soldiers: The first candle is a green one, followed by another green candle whose opening point is in between the open and close price of the first candle and the closing part is above the closing part of the first candle. Same is the case with the third candle (which is also green) with respect to the second candle. It is formed at the bottom of the chart and it signals an upcoming uptrend. For trade, wait for the formation of the next candle (i.e. the fourth candle). If it closes at a higher point than the closing point of the third candle, then you may enter the trade. You may place the stop loss at the low of the first candle.
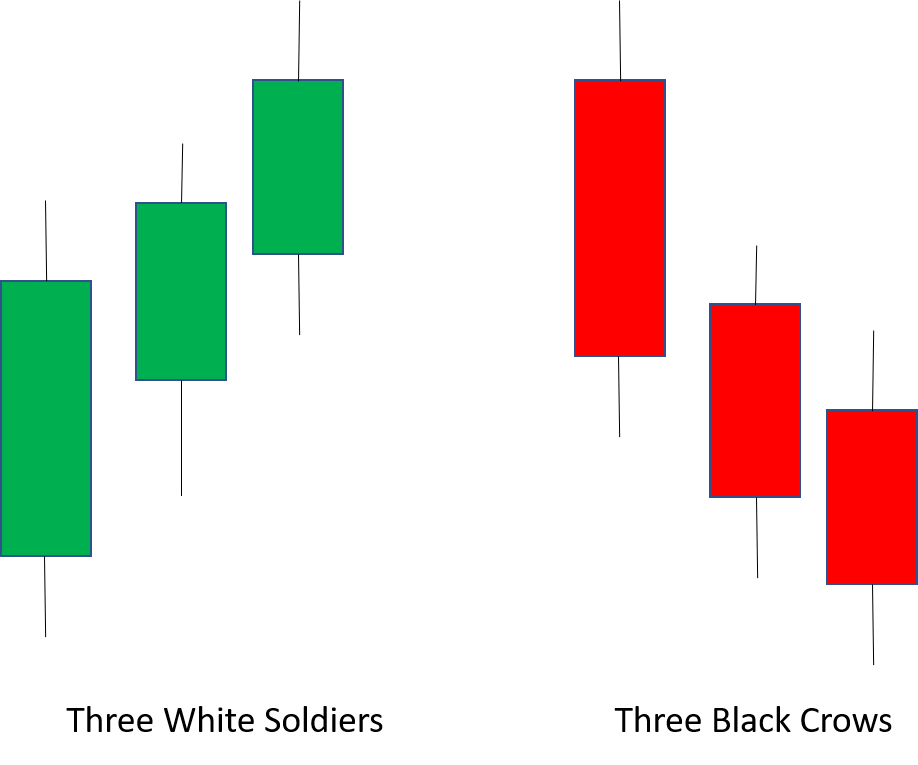
- Three Black Crows: The first candle is a red one, followed by another red candle whose opening point is in between the open and close price of the first candle and the closing part is below the closing part of the first candle. Same is the case with the third candle (which is also red) with respect to the second candle. It is formed at the top of the chart and it signals an upcoming downtrend. For trade, wait for the formation of the next candle (i.e. the fourth candle). If it closes at a lower point than the closing point of the third candle, then you may enter the trade. You may place the stop loss at the high of the first candle.
NoteThe white soldier candles are basically green ones. But in earlier days they used to be white.
The black crow candles are basically red ones. But in earlier days they used to be black.
Bullish Three Line Strike and Bearish Three Line StrikeSometimes a big different coloured candlestick is formed after Three White Soldiers or Three Black Crows. These are called Bullish Three Line Strike and Bearish Three Line Strike patterns. Here the fourth candle strikes (or eliminates the effect of) all the preceding three candles.
- Bullish Three Line Strike: If a big red candlestick is formed after the three green candles (i.e. the three white soldiers). If it is formed at the bottom of the chart then it is a bullish market indicator, but if it is formed at the top of the chart then it is a bearish market indicator.
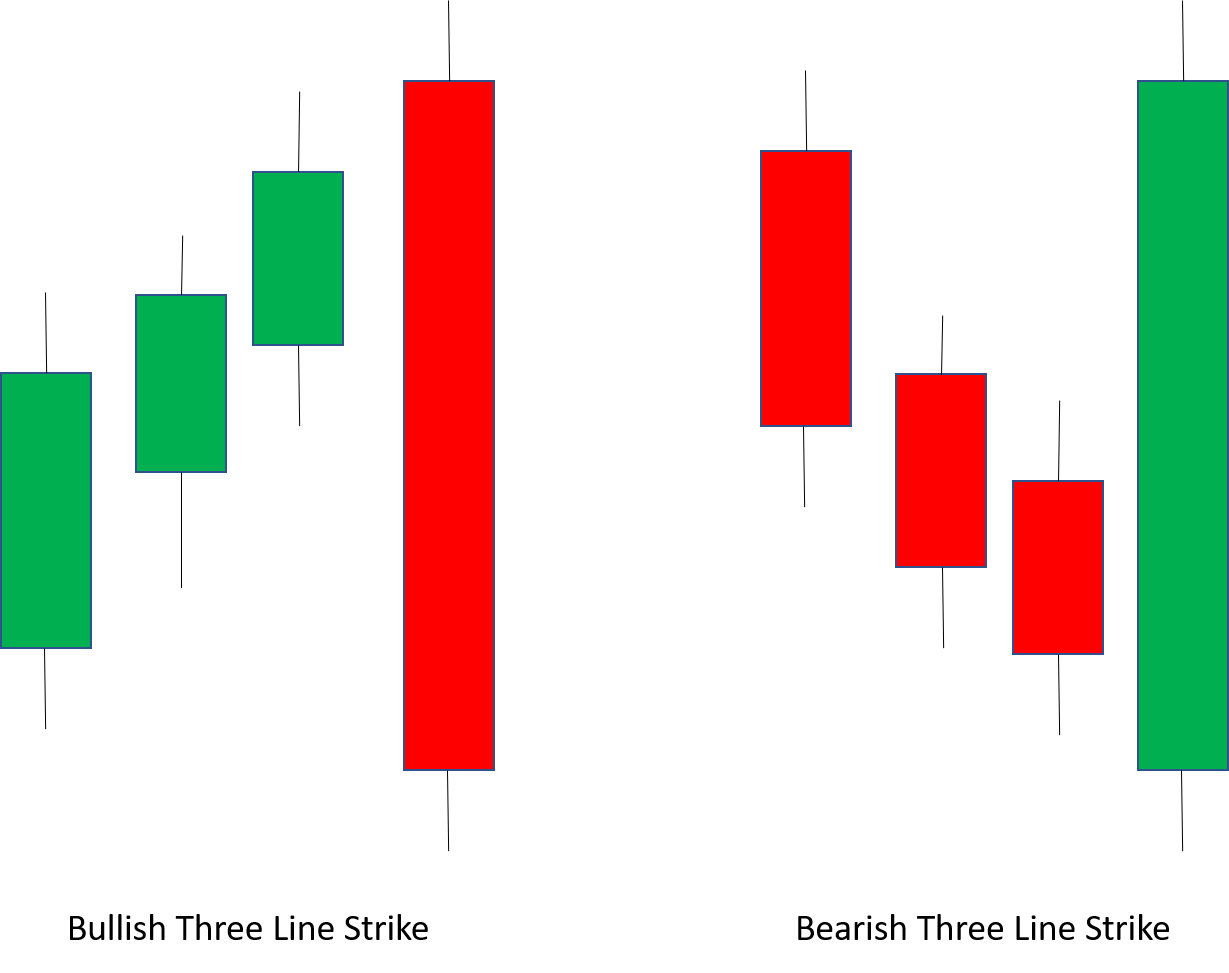
- Bearish Three Line Strike: If a big green candlestick is formed after the three red candles (i.e. the three black crows). If it is formed at the top of the chart then it is a bearish market indicator, but if it is formed at the bottom of the chart then it is a bullish market indicator.
Three Outside Up and Three Outside Down
- Three Outside Up: The first red candle is engulfed by the second green candle (bullish engulfing pattern), which should preferably have more trade volume. The third candle will also be green and it should definitely have substantially more trade volume than the first candle. It is formed at the bottom of the chart and indicates an upcoming uptrend. You may enter the trade at the high of the third candle, and put a stop loss at the low of the second candle.
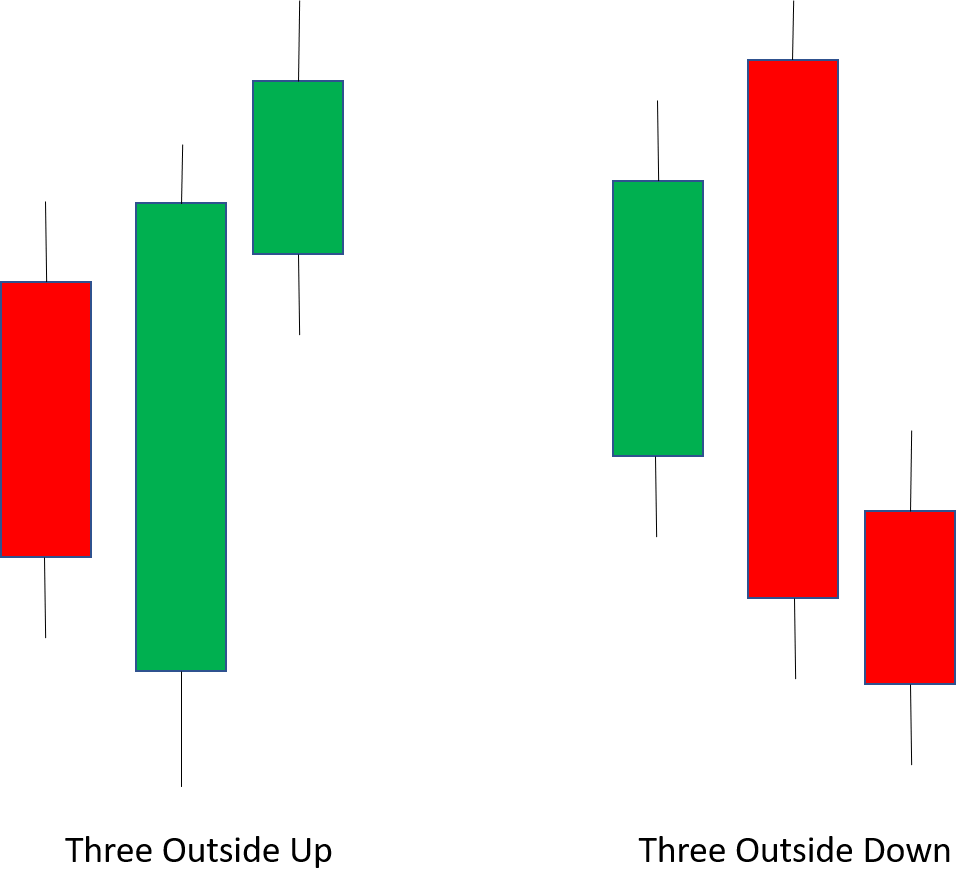
- Three Outside Down: The first green candle is engulfed by the second red candle (bearish engulfing pattern), which should preferably have more trade volume. The third candle will also be red and it should definitely have substantially more trade volume than the first candle. It is formed at the top of the chart and indicates an upcoming downtrend. You may enter the trade at the low of the third candle, and put a stop loss at the high of the second candle.
Three Inside Up and Three Inside Down
- Three Inside Up: The first red candle is followed by a second green candle (bullish harami pattern), which should preferably have more trade volume. The third candle will also be green and it should definitely have substantially more trade volume than the first candle. It is formed at the bottom of the chart and indicates an upcoming uptrend. You may enter the trade at the high of the third candle, and put a stop loss at the low of the first candle.
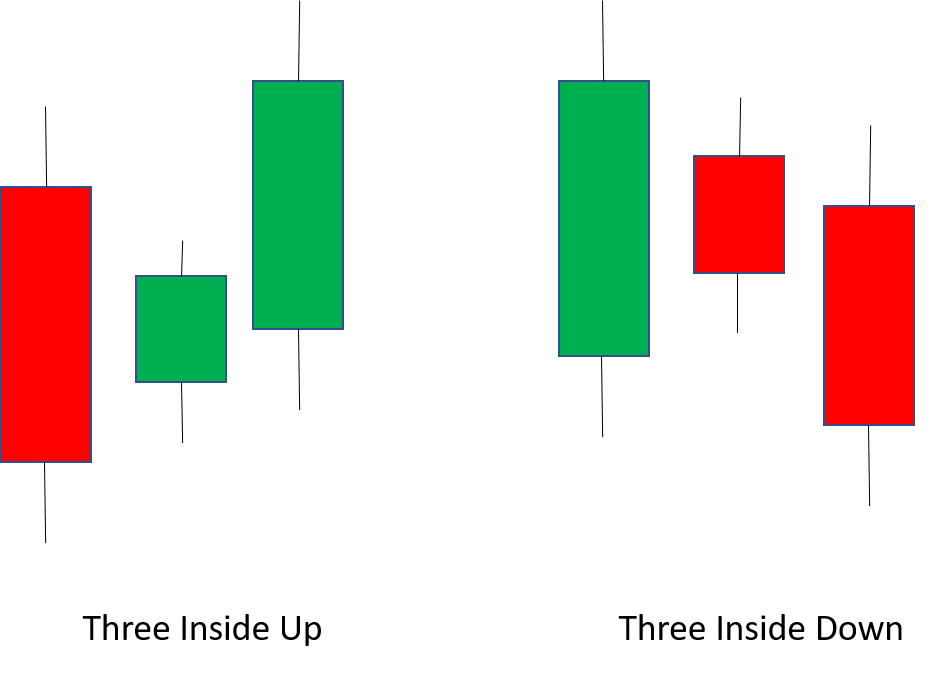
- Three Inside Down: The first green candle is followed by the second red candle (bearish harami pattern), which should preferably have more trade volume. The third candle will also be red and it should definitely have substantially more trade volume than the first candle. It is formed at the top of the chart and indicates an upcoming downtrend. You may enter the trade at the low of the third candle, and put a stop loss at the high of the first candle.
Winding Up
We hope this article will be of immense help to newbie stock traders, whether you are into Intraday, Commodity trading, Forex, or Futures/Options. You can use this knowledge of data interpretation for any index – be it Nifty Bank, Nifty 50, individual stocks, or Crypto-currencies.