Best Chart and Candlestick patterns that work!
There are hundreds of chart and candlestick patterns out there. But how can we remember so many, and how to know which of them do really work or not?
Most chart and candlestick patterns fail more often than they succeed. Only a few of them have a very good success rate. In fact, the most well-known chart and candlestick patterns are often the least successful, while some of the least known chart and candlestick patterns are often the most effective.
In this article, we intend to list down a few of the selected chart and candlestick patterns that do seem to work more often than they fail. This is based on our knowledge and experience. Opinions regarding such patterns may vary from one person to another. If you want to add on to our list (or want some pattern removed), we encourage you to leave a comment down below.
 Warning
You should not trade based on any chart and candlestick pattern, until and unless you have back tested (i.e. audited) it a hundred times.
See the charts where that pattern was formed, and see what happened thereafter (analyze at least 100 such examples/samples). Analyze the efficiency of that chart or candlestick pattern - make a table and write down how many times it succeeded, how big was the move, how many times stop loss was hit, etc. Only then you can use that knowledge in real trade.
This is called evidence-based trading, and professional traders do this only (not emotion-based trading). Without this, you will only be gambling your money away.
 Table of Contents
- Best Candlestick Patterns
- Best Chart Patterns
Best Candlestick Patterns
Some of such superstar candlestick patterns are (in this order - the best one on the top):
- Hammer Candlestick
- Engulfing Candlestick
- On Neck Breakout Pattern
- Doji Pattern
- Morning/Evening Star Candlestick
We have covered most on them in detail in this article of ours. So, let us just cover the one that we have not.
On Neck Breakout Pattern
It has both bullish and bearish variations. Also, this pattern will work on candlestick chart of any time duration - less than a day, weekly, monthly, etc.
Conditions for the formation of On Neck Breakout Pattern:
- There should be an upswing (i.e. 2-3 green candles)
- Thereafter, another green candle should be formed having a big body (and small wicks/shadows)
- After that, a red candle should be formed having a small body (wicks/shadows may be long or small). Preferably, it should be formed near or above the close of the previous green candle.
- Next candle (or the next to the next candle) should be a green breakout candlestick, and should close above the high of the previous red candle. (Breakout must come within the next two candles after the small-body red candle)
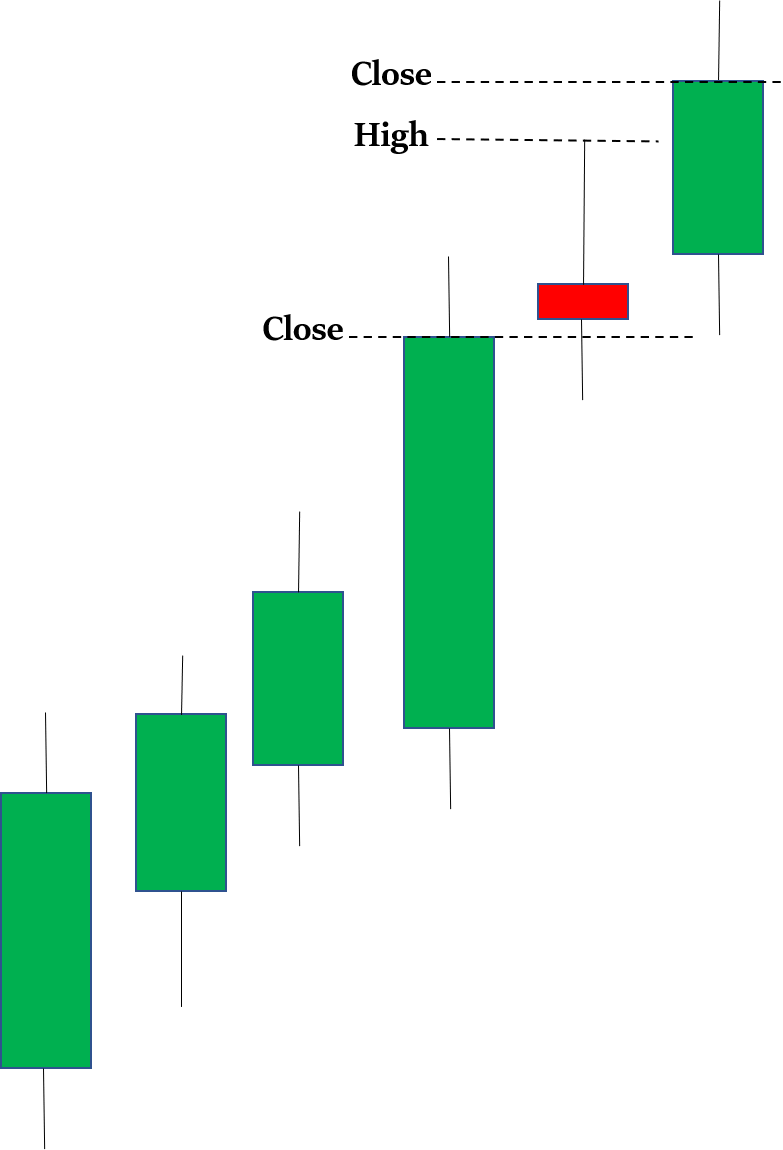
Then you may enter the trade by putting the stop loss at the low of the previous red candle.
Best Chart Patterns
Some of such superstar chart patterns are (in this order - the best one on the top):
- Head and Shoulder chart pattern and Inverse Head and Shoulder chart pattern – It probably has the best accuracy. (even better accuracy at 5 to 15 minute timeframe, not that much on daily or weekly charts)
- Bullish/Bearish Flag chart patterns
- Bullish/Bearish Symmetrical Triangle chart patterns – If the price before entering the triangle was showing an uptrend, then there are high chances that while exiting this triangle we will get an uptrend (and vice-versa). Enter trade only after the price has retested the resistance/support, and after looking at the PCR data.
- Ascending/Descending Triangle chart patterns
- Triple Top/Bottom chart patterns
- Double Top/Bottom chart patterns
- Bullish and Bearish Rectangle chart patterns – If the price before entering the rectangle was showing an uptrend, then there are high chances that while exiting this rectangle we will get an uptrend (and vice-versa). Its accuracy is a bit lower than Symmetrical Triangle chart patterns. You may enter the trade, but only after the price has retested the resistance/support, and after looking at the PCR data.
- Ascending/Descending Wedge chart patterns – Here it may be a bit difficult to gauge the direction of breakout. That is, this pattern may cause some confusion. So, obviously its accuracy is not very high.
- Cup and Handle chart pattern – Its accuracy is ok, but it’s not formed that often.
 Note
NoteIn intra-day trading, these chart patterns work the best uptil 15-minute timeframe. If you will see a bigger timeframe chart, you may often miss out the trend and the chance to enter the trade. Though positional traders may look at 60 minute or longer timeframe charts.
To read more about chart patterns, you may read this article of ours.
