Various Chart Patterns – Share Market Technical Analysis
While candlestick pattern analysis is a micro-level technical analysis, chart pattern analysis is more of a macro-level analysis. Candlesticks are like trees and Charts are like the forest. And as they say – Do not miss the forest for the trees!
In this article, we are going to learn about the various chart patterns. This knowledge will be immensely useful if you aim to trade using the knowledge of technical analysis.
There are three major categories of chart patterns:
- Reversal chart patterns
- Continuation chart patterns
- Neutral chart patterns
We will try to throw light on all of these major types of chart patterns, and will also learn their subtypes, various technical terms related to them, etc.
 Note
NoteWith chart patterns we also make use of some indicators, such as MACD (Moving Average Convergence Divergence), RSI (Relative Strength Index), Volume Indicator, etc.
If along with the chart patterns, these indicators also provide us a solid confirmation regarding an upcoming trend, then we can start trading or book profits. These indicators (and our experience) often help us avoid false breakouts and breakdowns.
 Warning
If you trade long enough, you will see almost all of these chart patterns failing. These are mere indicators of the near-future price action. Nothing is 100% perfect. Keep that in mind!
 Table of Contents
- Reversal chart patterns
- Continuation chart patterns
- Neutral chart patterns
Reversal chart patterns
We know that there are three kinds of possible trends in a stock chart – Uptrend, Downtrend, Sideways trend.
Reversal chart patterns indicate that the ongoing trend is about to change.
Double Top Pattern or M Pattern
Double top is formed in a stock chart if it encounters resistance twice, and both the times it fails to break the resistance.

Now, when the price falls after the second top, the candle that is formed at the neck line (called breakdown candle as it breaks the support) is important. You should observe your MACD, RSI, and Volume indicators here. The trade volume of the breakdown candle should be higher. Also, the trade volume at the first top must be higher than that at the second top.
Do not enter the trade at the breakdown candle (as it may be a false breakdown). Wait for the next candle. Watch closely if the price moves up again (the price may come up again to test the neckline). If it keeps on moving down, OR if it fails to break the neckline (after trying to go up) and then moves down again, then you may enter the trade. To double check, do also keep an eye on the MACD, RSI, and Volume indicators here. (If the price breaks the neckline, it may form a triple top)
We will put stop loss at the high of the breakdown candle, and our target will be as much below the neckline, as the double-tops were above the neckline. (You may also use a trailing stop loss) As you may have noticed, this chart pattern showcases that an ongoing uptrend is about to reverse, and a downtrend is about to come.
NoteJust like we have Double Top Pattern (or M Pattern) that indicates an oncoming downtrend, we have Double Bottom Pattern (or W Pattern) that indicates an oncoming uptrend.
Triple Top Pattern
It’s similar to Double Top Pattern. Here, 3 tops will be formed instead of 2.

Ideally, the trade volume should be the highest in the first top, followed by second and third tops. Rest of the concept is very much similar to Double Top Pattern.
NoteJust like we have Triple Top Pattern that indicates an oncoming downtrend, we have Triple Bottom Pattern that indicates an oncoming uptrend.
NoteIn case of double or triple top/bottom patterns, there should preferably be 6-8 candles between any two given tops. Otherwise, we won’t consider them as double or triple top/bottom patterns. That is, the tops (or bottoms) should not be very close together.
Also, the tops (or bottoms) need not be exactly at the same level; even if they are 3-5% up or down with respect to each other, we will still consider it to be a double or triple top/bottom pattern.
Moreover, the neckline that we draw need not always be horizontal. It may be slanted, i.e. with some slope.
Head and Shoulder Pattern
It’s somewhat similar to triple top pattern. The only difference being that the price breaks the resistance 1 at the second top (forming the head), and forms a new resistance (we can call it resistance 2).

You may have noticed that the price fails to break the resistance 1 again at the third top (forming the second shoulder).
Now, when the price falls after the second shoulder, the candle that is formed at the neck line (called breakdown candle as it breaks the support) is important. You should observe your MACD, RSI, and Volume indicators here. The trade volume of the breakdown candle should be higher. Also, the trade volume at the first shoulder must be higher than that at the second shoulder.
Do not enter the trade at the breakdown candle (as it may be a false breakdown). Wait for the next candle. Watch closely if the price moves up again (the price may come up again to test the neckline). If it keeps on moving down, OR if it fails to break the neckline (after trying to go up) and then moves down again, then you may enter the trade. To double check, do also keep an eye on the MACD, RSI, and Volume indicators here.
We will put stop loss at the high of the breakdown candle, and our first target will be as much below the neckline, as the two shoulders were above the neckline. (You may also use a trailing stop loss) Our second target will be as much below the neckline, as the head was above the neckline.
As you may have noticed, this chart pattern showcases that an ongoing uptrend is about to reverse, and a downtrend is about to come.
NoteJust like we have Head and Shoulder Pattern that indicates an oncoming downtrend, we have Reverse Head and Shoulder Pattern that indicates an oncoming uptrend.
NoteIn case of Head and Shoulder patterns, there should preferably be 6-8 candles between any two given tops. Otherwise, we won’t consider them as Head and Shoulder patterns. That is, the tops/bottoms should not be very close together.
Also, the shoulders need not be exactly at the same level; even if they are 3-5% up or down with respect to each other, we will still consider it to be a Head and Shoulder pattern.
Moreover, the neckline that we draw need not always be horizontal. It may be slanted, i.e. with some slope.
Rising Wedge Pattern
Here, the subsequent tops are higher than the previous ones, but the subsequent bottoms are rising faster than the tops. That is, if you draw two lines – one joining the tops and the other joining the bottoms, you will see that the slope of the line joining the bottoms is higher. These two lines will form kind of a rising wedge.

This happens because with time sellers are gaining strength over the buyers, and it indicates that a major downward trend is about to come.
Now, the candle that is formed at the neck line (called breakdown candle as it breaks the support) is important. You should observe your MACD, RSI, and Volume indicators here. The trade volume of the breakdown candle should be higher.
Do not enter the trade at the breakdown candle (as it may be a false breakdown). Wait for the next candle. Watch closely if the price moves up again (the price may come up again to test the neckline). If it keeps on moving down, OR if it fails to break the neckline (after trying to go up) and then moves down again, then you may enter the trade. To double check, do also keep an eye on the MACD, RSI, and Volume indicators here.
We will put stop loss at the high of the breakdown candle (or at the resistance level), and our targets will be the various support levels.
NoteJust like we have Rising Wedge Pattern that indicates an oncoming downtrend, we have Falling Wedge Pattern that indicates an oncoming uptrend.
Bearish Expanding Triangle Pattern
It’s somewhat reverse of the Rising Wedge Pattern.
Here, the subsequent tops are higher than the previous ones, but the subsequent bottoms are rising slower than the tops. That is, if you draw two lines – one joining the tops and the other joining the bottoms, you will see that the slope of the line joining the bottoms is lower. These two lines will form kind of an expanding triangle pattern.

This happens because with time buyers are gaining strength over the sellers, and it may indicate that a major upward trend is about to come. However, it also indicates that market volatility is increasing. So, we may go very wrong. If any candle breaks the neckline, we may also see a huge downtrend.
NoteJust like we have Bearish Expanding Triangle Pattern that may indicate an oncoming downtrend, we have Bullish Expanding Triangle Pattern that may indicate an oncoming uptrend.
Continuation chart patterns
Continuation chart patterns indicate that the ongoing trend will continue.
Bullish Rectangle Pattern
If during an uptrend, the price gets stuck inside a rectangle (i.e. price consolidation happens, or a sideways trend is seen) and it kind of forms a W, then you should wait for the breakout candle.

If the breakout candle breaks the resistance, then the uptrend may continue (though the price may come down again to test the new support formed). Make sure you observe your RSI, MACD, and Volume indicators near the breakout candle. They should confirm the breakout. Ideally, the trade volume at breakout candle should be higher than before, otherwise it may be a fake breakout.
NoteIt looks like Double Bottom Pattern (or W Pattern). However, in case of Double Bottom pattern there was an ongoing downtrend (W pattern indicates that downtrend is about to reverse), while here there’s an ongoing uptrend (Bullish Rectangle suggests that uptrend will continue).
If you are a risk-taking trader, you may enter the trade at the breakout candle itself, by keeping the stop loss at the low of the breakout candle. You may also put the stop loss at the middle of the rectangle.
Or, maybe wait for another candle to get the confirmation of breakout. If the next candle breaks the high of the breakout candle than you may enter the trade.
However, if you are a safe trader, you may wait till the price retests the new neckline (though it’s not necessary that price will do this retesting – in that case you would lose the opportunity to enter the trade).
Your target maybe as much above the old resistance, as the previous support was below it. In other words, your target may be the width of the rectangle above the old resistance.
NoteJust like we have Bullish Rectangle Pattern that forms during an uptrend, we have Bearish Rectangle Pattern that forms during a downtrend.
Bearish Rectangle Pattern looks like Double Top Pattern (or M Pattern). However, in case of Double Top pattern there was an ongoing uptrend (M pattern indicates that uptrend is about to reverse), while here there’s an ongoing downtrend (Bearish Rectangle pattern suggests that downtrend will continue).
Bullish Flag Pattern
If during an uptrend, the price gets stuck inside a downward rectangle, then you should wait for the breakout candle.

Such a downward rectangle is formed when the successive resistance and support levels keep on declining. Here you will draw inclined trend lines, which together will look like a flag.
If you are a risk-taking trader, you may enter the trade at the breakout candle itself, by keeping the stop loss at the low of the breakout candle. You may also put the stop loss at the lowest support level inside the inclined rectangle (which is Support 2 in the given figure).
Or, maybe wait for another candle to get the confirmation of breakout. If the next candle breaks the high of the breakout candle than you may enter the trade.
However, if you are a safe trader, you may wait till the price retests the new neckline (though it’s not necessary that price will do this retesting – in that case you would lose the opportunity to enter the trade).
Your target maybe as much above the breakout point, as the previous support was below it.
NoteJust like we have Bullish Flag Pattern that forms during an uptrend, we have Bearish Flag Pattern that forms during a downtrend.
Bullish Pennant Pattern
If during an uptrend, the price gets stuck inside a pennant (sideways movement), then you should wait for the breakout candle.

If you are a risk-taking trader, you may enter the trade at the breakout candle itself, by keeping the stop loss at the low of the breakout candle.
Or, maybe wait for another candle to get the confirmation of breakout. If the next candle breaks the high of the breakout candle than you may enter the trade.
You may trade with a 1:2 or 1:3 risk-reward ratio. If things go your way, you may also place a trailing stop loss and maximize your profits.
NoteJust like we have Bullish Pennant Pattern that forms during an uptrend, we have Bearish Pennant Pattern that forms during a downtrend.
NoteBullish Symmetrical Triangle Pattern is similar to Bullish Pennant Pattern. The only difference being that Bullish Pennant Pattern is formed in short-duration candlestick charts, while Bullish Symmetrical Triangle Pattern is formed in long-duration candlestick charts (weekly or monthly charts).
Similarly, Bearish Symmetrical Triangle Pattern is also formed in long-duration candlestick charts (weekly or monthly charts).
Cup and Handle Bullish Pattern
If during an uptrend, the price encounters a resistance and comes down, but then shows a U-shape recovery (fall, then sideways movement, then rise), and thereafter falls down from the same resistance level and again shows a small U-shape recovery, then you should wait for the breakout candle.

If you are a risk-taking trader, you may enter the trade at the breakout candle itself, by keeping the stop loss at the low of the breakout candle.
Or, maybe wait for another candle to get the confirmation of breakout. If the next candle breaks the high of the breakout candle than you may enter the trade.
NoteThere are a few things you should keep in mind. The price recovery should be U-shaped, and not V-shaped (i.e. there should be some sideways price trend too).
Also, the height of the second U-shape (i.e. smaller handle) should not be more than half (one-third as per some experts) than the first U-shape (i.e. larger cup). If these conditions are not fulfilled, this will not be called a Cup and Handle Bullish Pattern.
You may trade with a 1:2 or 1:3 risk-reward ratio. If things go your way, you may also place a trailing stop loss and maximize your profits.
NoteJust like we have Cup and Handle Bullish Pattern that forms during an uptrend, we have Reverse Cup and Handle Bearish Pattern that forms during a downtrend.
Neutral chart patterns
When neutral chart patterns are formed, there’s generally a sideways movement. We cannot tell whether ultimately we will get an uptrend or a downtrend until and unless we get a breakout or a breakdown.
Ascending Triangle Pattern
In this pattern, we get to see a sideways movement, such that there’s a constant resistance level, but the support levels keep on increasing.

We will have to wait for the breakout/ breakdown candle to see whether at the end of it we will get an uptrend or a downtrend.
- If the price falls, then we can keep the stop loss at the resistance level. We can trade with 1:2 or 1:3 risk-reward ratio. Our entry point may be the next candle after the breakdown candle, if that candle breaks the low of the breakdown candle (as it’s advisable to enter the trade only after we get a confirmation).
- If the price rises, then we can keep the stop loss at the last support level. We can trade with 1:2 or 1:3 risk-reward ratio. Our entry point may be the next candle after the breakout candle, if that candle breaks the high of the breakout candle (as it’s advisable to enter the trade only after we get a confirmation).
Also, we can always use a trailing stop loss to maximize our profits.
NoteAs always, make sure that the trade volume at the breakout/ breakdown candle is more. Also, apply your indicators here for further confirmation.
NoteJust like we have Ascending Triangle Pattern, we also have Descending Triangle Pattern. In this pattern, the support level keeps constant, but the resistance level keeps on decreasing. Rest of the basic concepts are almost the same as that in Ascending Triangle Pattern.
Symmetrical Contracting Triangle Pattern
In this pattern, we get to see a sideways movement, such that the resistance levels keep on decreasing, but the support levels keep on increasing.
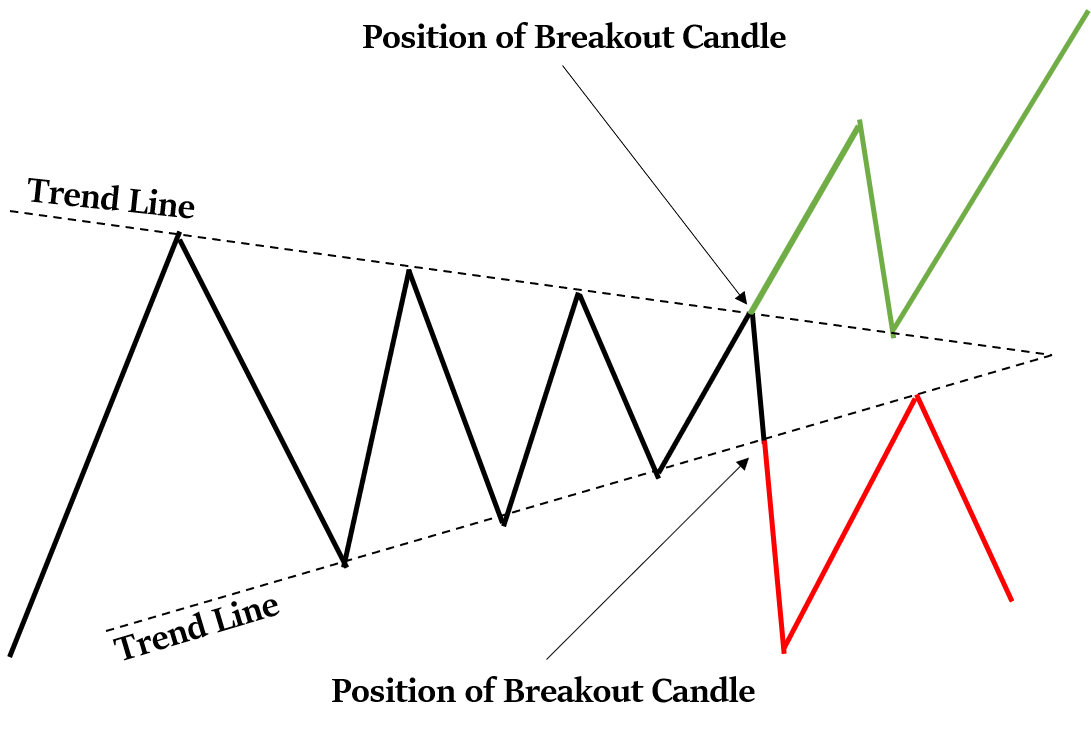
We will have to wait for the breakout/ breakdown candle to see whether at the end of it we will get an uptrend or a downtrend.
- If the price falls, then we can keep the stop loss at the last resistance level, or at the median of the triangle. We can trade with 1:2 or 1:3 risk-reward ratio. Our entry point may be the next candle after the breakdown candle, if that candle breaks the low of the breakdown candle (as it’s advisable to enter the trade only after we get a confirmation).
- If the price rises, then we can keep the stop loss at the last support level, or at the median of the triangle. We can trade with 1:2 or 1:3 risk-reward ratio. Our entry point may be the next candle after the breakout candle, if that candle breaks the high of the breakout candle (as it’s advisable to enter the trade only after we get a confirmation).
Also, we can always use a trailing stop loss to maximize our profits.
NoteJust like we have Symmetrical Contracting Triangle Pattern, we also have Symmetrical Expanding Triangle Pattern. In this pattern, the support level keeps on decreasing, but the resistance level keeps on increasing. Rest of the basic concepts are almost the same as that in Symmetrical Contracting Triangle Pattern.
What time-frame chart should we observe?Well, it depends on the kind of trade you are doing. The concepts will remain the same in all.
- If you are scalping, you should preferably observe candlesticks of 1 minute, 3 minutes, or 5 minutes duration.
- If you are doing intra-day trade, you should preferably observe candlesticks of 5 minutes, 10 minutes, or 15 minutes duration.
- If you are swing trading, you should preferably observe candlesticks of 15 minutes duration, or more.
Winding Up
We hope this article would have enhanced your technical analysis skills a lot.
Though keep in mind, that learning these chart patterns is easy, but applying this knowledge in real-life trading is a different ball game altogether. That will require you to practice – a lot!